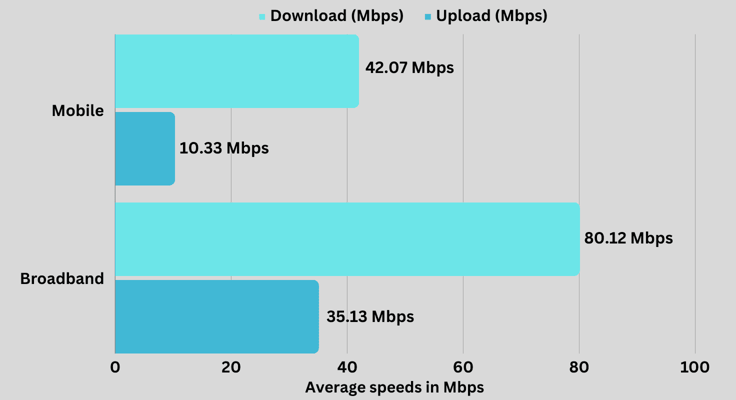
The global average download speed for fixed broadband is 80.12 Mbps.1 If you Google “internet speed test,” you can check your internet speed for free through the Speedtest tool that appears at the top of the page. That number could be responsible for you feeling frustrated by a slow website.
But your internet speed is not the sole reason some websites run slowly on your device. The webpage loading speed may be affected by the bandwidth offered by its web host, poorly written code, unoptimized media files, inadequate caching techniques, the lack of a content delivery network (CDN), or too many ads.
To put it into perspective, the average website page takes 2.5 seconds to load on a computer and 8.6 seconds on a mobile device.2 Webpages that take longer to load (especially on eCommerce sites) are likely to leave visitors disgruntled. That means you need a quick website to keep customers happy.
Here are some interesting website load time statistics that highlight the importance of a fast site.
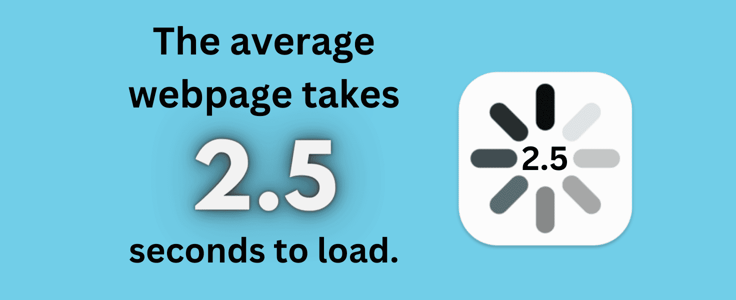
1. The Average Webpage Takes 2.5 Seconds to Load on a Computer
Webpages that load quickly are more likely to attract and retain customers. On average, a webpage takes 2.5 seconds to load on a computer.2
Visitors may avoid a business with slow webpage loading speeds, as they do not understand the attention economy, which is key to success.
2. The Average Website Page Takes 8.6 Seconds to Load on Mobile
Online surfing is significantly faster (3.44x or 244% faster) on a computer than on a mobile device.2 To put it into perspective, the average website page takes 6.1 more seconds to load on a mobile device when compared to a computer (2.5 seconds).
3. The Average Fixed Broadband Download Speed is 80.12 Mbps
In some cases, your internet speed may be the sole reason a website loads slowly on your device. The global average fixed broadband download speed is 80.12 Mbps.1
If your internet speed is slower than this, it may be time to talk to or change your broadband provider.
4. Singapore Has an Average Fixed Broadband Speed of 242.01 Mbps
Most website owners understand the importance of the attention economy and employ all necessary techniques to ensure fast website load times.
If you reside in Singapore, you need not worry about slow internet speeds spoiling the party, as Singapore has the world’s fastest average fixed broadband speed of 242.01 Mbps.3
5. Chile Has an Average Fixed Broadband Speed of 222.49 Mbps
Chile has the world’s second-fastest average fixed broadband speed of 222.49 Mbps, followed by the United Arab Emirates (216.78 Mbps), China (215.8 Mbps), and Hong Kong (205.19 Mbps), rounding out the top five.3
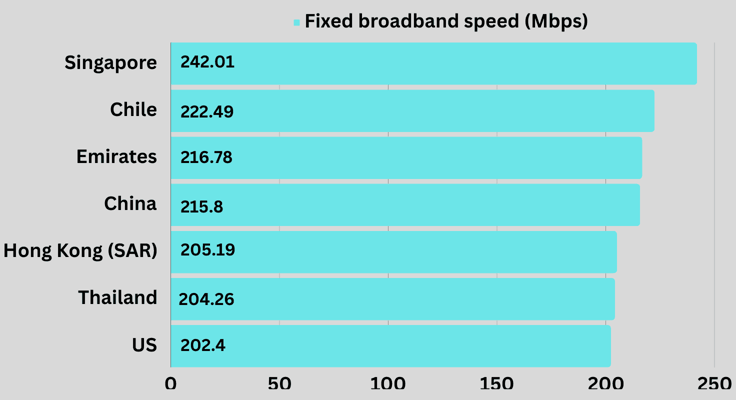
The US has an average fixed broadband internet speed of 202.4 Mbps, so there’s room for improvement.
6. The Average Mobile Download Speed Measures In At 42.07 Mbps
There are an estimated 5.25 billion smartphone users in the world.4 That equates to nearly 65% of the world’s population.5 This means it’s vital for businesses to optimize their websites for mobile browser surfing.
The global average download speed for mobile internet is 42.07 Mbps, and if your mobile internet service provider (ISP) offers a download speed around that mark, it is doing its part.1
7. The Average Bounce Rate for eCommerce Websites is 47%
Bounce rate refers to the percentage of visitors who leave your website after viewing only one webpage.
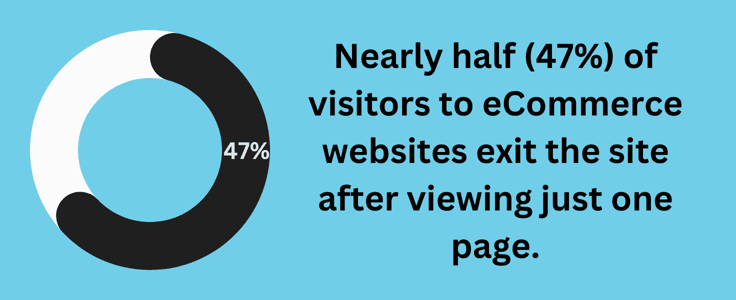
The average bounce rate for eCommerce platforms is a whopping 47%. Most websites have a bounce rate ranging between 26% to 70%.6
8. A Bounce Rate of 26% to 40% is Ideal
It’s impossible to convert all visitors into paying customers, but you can improve your bounce rate. While a bounce rate of 26% to 40% may sound excessive, it is considered excellent as most websites have a higher bounce rate.6
9. The Average Desktop User Bounce Rate is A Whopping 50%
Desktop users have the lowest bounce rate average of 50%, followed by tablet users (51.6%), and mobile users (56.8%).2

Why? Screen size, loading speeds, content optimization, and a responsive user interface (UI) design may play a major role. After all, not every website is optimized for tablets or mobile phones.
10. A Mobile Page Load Time of 10 Seconds Increases the Bounce Rate by 123%
Obviously, the longer the webpage load time, the greater the website’s bounce rate: A webpage load time of 10 seconds on mobile increases the bounce rate by an astonishing 123%.2 In this digital era, speed is of the essence, so be sure to keep your loading speeds within a couple of seconds at most.
11. More Than Half (53%) of Mobile Visitors Will Leave If It Takes 3+ Seconds to Load
If a webpage on a mobile browser takes more than three seconds to load, 53% of visitors will leave the page, further highlighting the importance of optimized webpage loading times on mobile.2
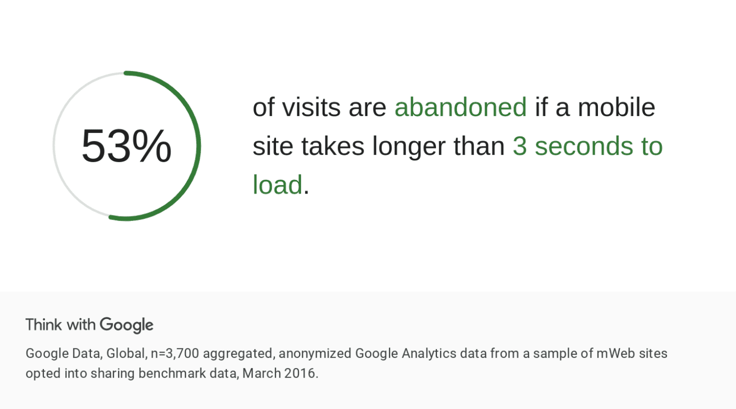
This comes as no surprise: Google recommends keeping page loading times in less than three seconds for optimal user experience.
12. Website Conversion Rates Drop by 4.42% Per Second of Load Time
If you operate an eCommerce business, this statistic is significant: For every second of webpage load time between zero and five seconds, website conversion rates drop by 4.42%.2
In other words? The quicker, the better!
13. Page Speed Impacts the Purchase Decision of 70% of Online Shoppers
It may be possible to buy the same product from multiple online retailers, and we often compare pricing on several platforms before making a purchase decision.
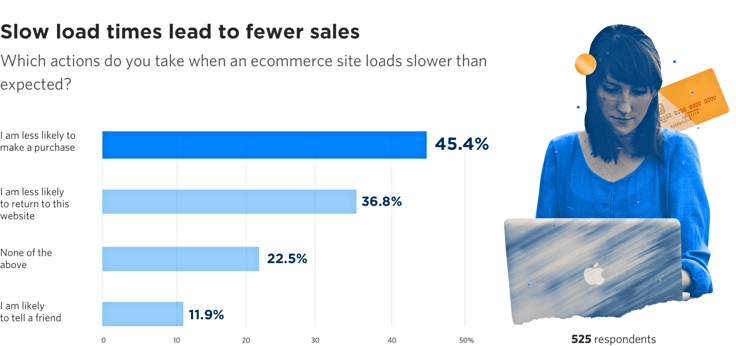
Many consumers may prefer an online retailer due to its faster webpage loading speed. In fact, 70% of online shoppers report page speed impacts their willingness to buy from an eCommerce site.2
14. Desktop Users Average 3.4 Webpages Per Online Session
Compared to mobile devices, desktops are easier when it comes to switching between web pages. The fact that desktop users visit more pages, about 3.4 on average, shows that it’s simpler and more convenient for them to check out different pages in one go.2
15. The Sports Industry Has 200 Million Mobile Sessions Annually
Given how popular sports such as football, basketball, and cricket have frenzied fan followings, it is easy to understand why the sports industry has the most year-on-year mobile sessions, with 200 million.2
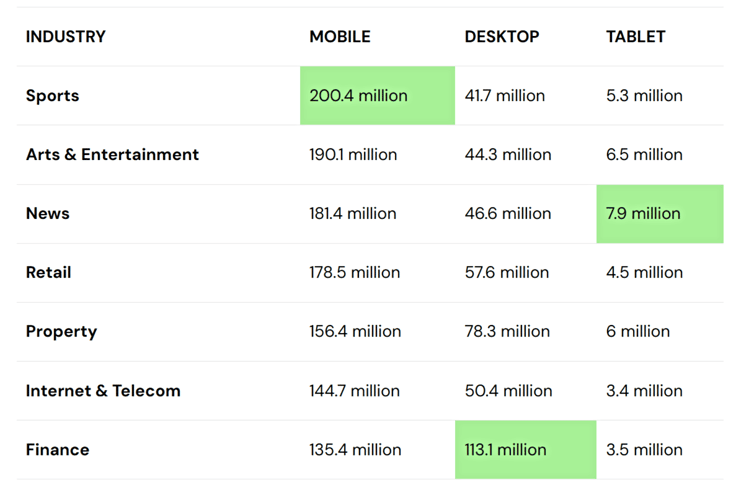
Furthermore, tablets are the most popular for news consumption, averaging 7.9 million sessions, while finance content is predominantly accessed on desktops, with an annual average of 113.1 million sessions.
16. The Science Industry Has the Highest Mobile Bounce Rate of 66.37%
We often search for cool scientific facts, and those facts are regularly compiled as lists on single web pages. That gives the science industry the highest mobile bounce rate of 66.37%.2
17. eCommerce Websites Average 5.01 Pages Per Desktop Session
Move aside window shopping, e-window shopping is the new trend. Desktop users average 5.01 webpage visits on eCommerce websites per session.2 This is higher than any other industry.
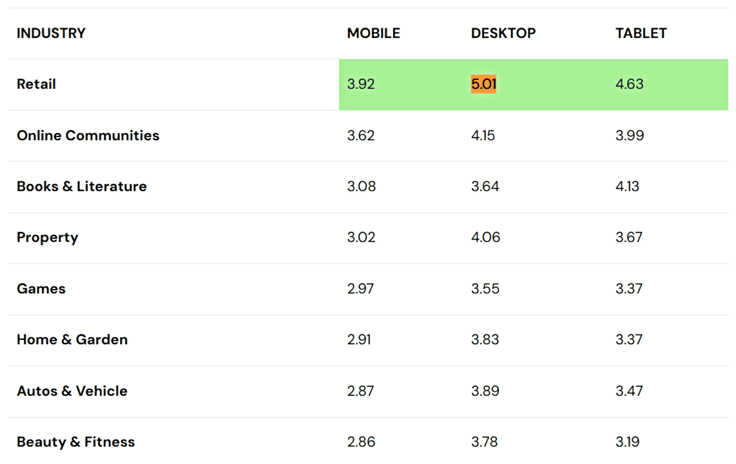
Following eCommerce sites in popularity are online communities (like Reddit or Facebook), books and literature platforms (such as Goodreads), and property-related websites (like Zillow).
18. Mobile Users Make Up More Than 68% of All Website Visits
Given that nearly 65% of the global population owns a mobile device, it is not surprising that mobile users dominate the web.5 And an impressive 68.2% of all website visits come from mobile users.2
19. Desktop Users Make Up Nearly 30% of All Website Visits
The next dominant category of internet users, those using desktops, are responsible for 29.5% of all website traffic.2
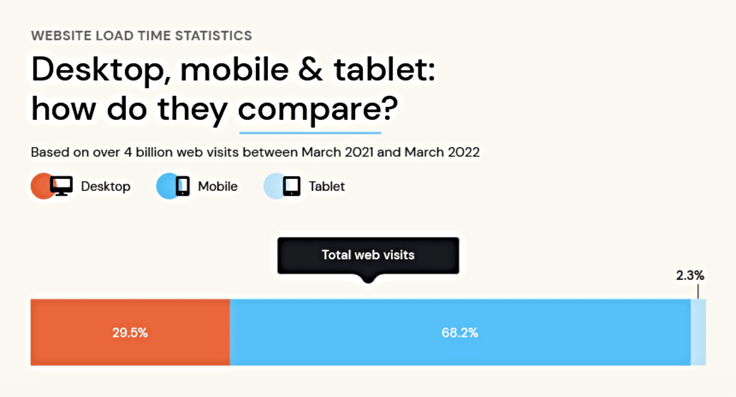
While mobile traffic trumps desktop traffic by more than 45%, desktop sessions result in a higher number of average pages (31% more) visited.2
20. Tablet Users Make Up 2.3% of Website Visits
A little more than 4 million sessions come from tablet users each year, which is 2.3% of all website traffic. But tablet users average a higher number of pages per session (3.1) compared to mobile users (2.6).2
21. One in Four Visitors Abandon Slow Websites
Data shows that 25% of website visitors will abandon a site if it takes more than four seconds to load.7

This means you could lose 25% of potential customers if your website loads more than 1.5 seconds slower than the average webpage loading time of 2.5 seconds.2
22. Almost Half (46%) of Users Don’t Revisit Low-Ranking Websites
A long website load time will lead to a high bounce rate: An incredible 46% of users don’t revisit low-ranking websites.7 This means they’re more likely to go to a competitor next time. High bounce rates signal to search engines, like Google, that users don’t find the content useful, potentially causing a drop in their search ranking.
23. User Experience (UX) is Critical to 79% of Online Shoppers
Alongside delivering stellar website load times, website owners must focus on crafting an exceptional user experience. That’s because 79% of online shoppers who are dissatisfied with a platform’s user experience will not revisit it.7

A substantial portion (64%) of dissatisfied shoppers would opt to make their purchases from a different online store instead, which means creating a great user experience is crucial for retaining customers and avoiding losing them to competitors.
24. A One-Second Website Delay Reduces Customer Satisfaction by 16%
In the game of speed and consistency, you need to deliver the best overall user experience to stay on top. A one-second delay in website load time reduces customer satisfaction by 16%.7 Talk about fine margins!
25. Top Websites Have an Average Load Time of 1.65 Seconds
If your website features on the first page of Google Search results, you are doing things correctly.
Top-ranked websites on Google Search have an average load time of just 1.65 seconds.7 That is 0.85 seconds quicker than the average webpage loading speed.
26. A Surprising 40% of Users Will Abandon a Website After Waiting for 2-3 Seconds
Data shows that 40% of consumers have a “patience span” of 2 to 3 seconds before they abandon a website.7 eCommerce users largely engage in e-window shopping before purchasing a product, and a slow website load time is not conducive to happy shopping. Ensure your internet connection is working properly before giving up on a website altogether.
27. A Website Load Time of More Than 2 Seconds Experiences a 9% Bounce Rate
If your website loads in less than two seconds, it will experience a low average bounce rate of 9%.7
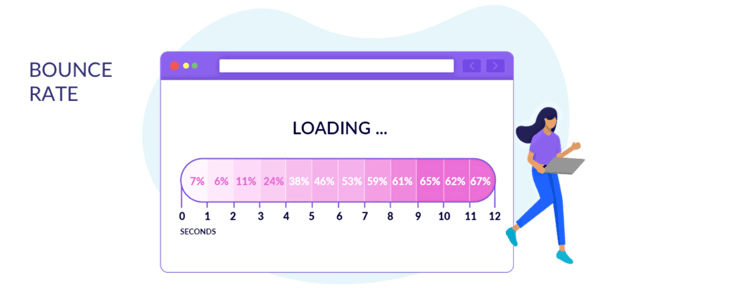
If you manage to secure this bounce rate (a top web host could help considerably), you are in an elite company, as a bounce rate of 26% to 40% is acceptable worldwide.6
28. A One-Second Webpage Load Time Makes Users Feel In Control
If you tick all the right boxes and deliver a website that loads in one second or less, you are set up for success. A one-second website load time makes users feel in control and stress-free.7
29. BBC Loses 10% of Users for Every Second of Delayed Loading Speeds
Imagine losing 10% of your audience for a second of site load delay — BBC suffers that fate.7
Fortunately, a reduction in website loading time seems to have a similarly enormous impact on companies the size of BBC. Yahoo! saw a 9% increase in web traffic when it decreased its page load time by 0.4 seconds.7
30. Almost Half (46%) of Mobile Users Dislike Waiting for a Page to Load
Many mobile phone users (46%) do not like waiting for a page to load.7 The most surprising part about this statistic is that it isn’t higher. This just goes to show that traits like customer loyalty and patience do exist.
31. Three-Quarters of US Mobile Users Abandon Websites That Load in 5+ Seconds
There are more than 310 million smartphone users in the US, with a smartphone penetration rate of an astounding 92%. And that number is only expected to rise over time.8
And roughly 230 million US smartphone users (74% of 310 million) abandon mobile websites that take more than five seconds to load.7
32. Nearly Three-Quarters (73%) of Mobile Users Encounter Slow Websites
Most mobile internet users (73%) encounter slow websites, but that is not the extent of the inconvenience.7
More than half (51%) encountered a website that received an error, froze, or crashed, 48% experienced website formatting issues, and 38% encountered an unavailable website.7 Fortunately, most of these issues can be solved by implementing Accelerated Mobile Pages (AMPs).
These pages are ultra-fast and load almost instantly. Given how mobile browsing is considerably slower than desktop browsing, we recommend all mobile website owners consider the technology.
33. A Whopping 32% of Marketers Don’t Have the Resources for AMPs
With a vast number of small blogs and low-budget businesses on the internet, 32% of marketers lack the developer resources to incorporate AMP technology on their mobile websites.7
This is unfortunate, as AMPs are basically a stripped-down HTML version, allowing mobile browser pages to load almost instantly.
34. Mobile Devices Make Up 55% of Online Shopping Sessions
Approximately 65% of the global population, or 5.25 billion people, use mobile devices.4,5 With this in mind, it’s hardly surprising that 55% of all online retail takes place on mobile.7
Here’s why: A mobile device provides greater convenience than a computer and allows you to shop anywhere, so make sure your site is mobile-friendly.
35. A One-Second Webpage Delay Could Cost Your Business $2.5 Million
If you operate an online business that earns more than $100,000 every day, you could lose $2.5 million in sales each year for every second of webpage loading delay.7
That is one instance in which speed directly correlates to money: This also translates to a drop in conversion rates by 7%.
36. A One-Second Website Delay Reduces Conversions by 4.42%
With fierce competition in eCommerce, even one second in website loading delay will see an increased bounce rate and decreased activity on a website. In fact, for every second of site loading delay, conversions on an eCommerce website will reduce by 4.42%.7
37. A 0.1-Second Website Improvement Increases Conversions by 8.4%
Customers appreciate the speed and efficiency of websites. While website loading delays can have negative impacts, an improvement in website loading speeds can reward a company.
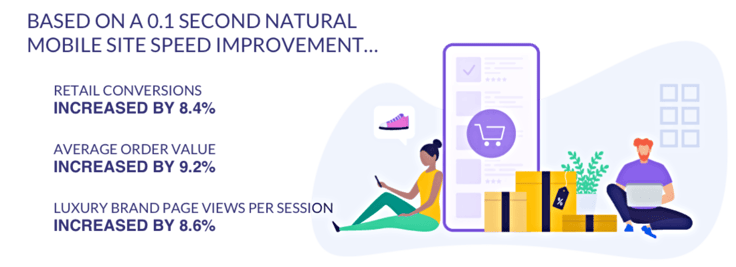
A natural improvement of 0.1 second in site load time can increase online retail conversions by 8.4%.7 It also increases the average order value by 9.2% and luxury brand page viewing by 8.6%.7
38. A Startling 18% of Online Shoppers Will Abandon Their Cart if Checkout is Slow
Consumers face this situation often. They may fill their online carts with products, but slow load times at checkout frustrate them.
Eventually losing patience, they switch to another platform that offers a better shopping experience — which may inspire longer-term loyalty. And 18% of online shoppers feel similarly, as they would abandon their cart if checkout pages were too slow.7
39. Fast Websites Are Preferred by 14% of eCommerce Customers
If your eCommerce website takes too long to load, chances are that customers will switch to another website. In fact, 14% of eCommerce users will switch to another platform if they have to wait for a webpage to load.7

Additionally, 85% of mobile users anticipate that pages load as fast as or faster than on a desktop.7
40. Checkout Speed Determines Loyalty for 46% of Online Shoppers
No one wants to wait in a long queue to pay their bill at a mall. Similarly, online shoppers don’t enjoy eCommerce websites that offer a slow checkout process. Nearly half (46%) of online shoppers will return to a website that offers quick checkout, displaying customer loyalty.7
41. Videos Comprise An Incredible 60% of a Website’s Total Weight
Non-optimized media files like videos could drastically slow down your site, as they account for 60% of a website’s total weight.7
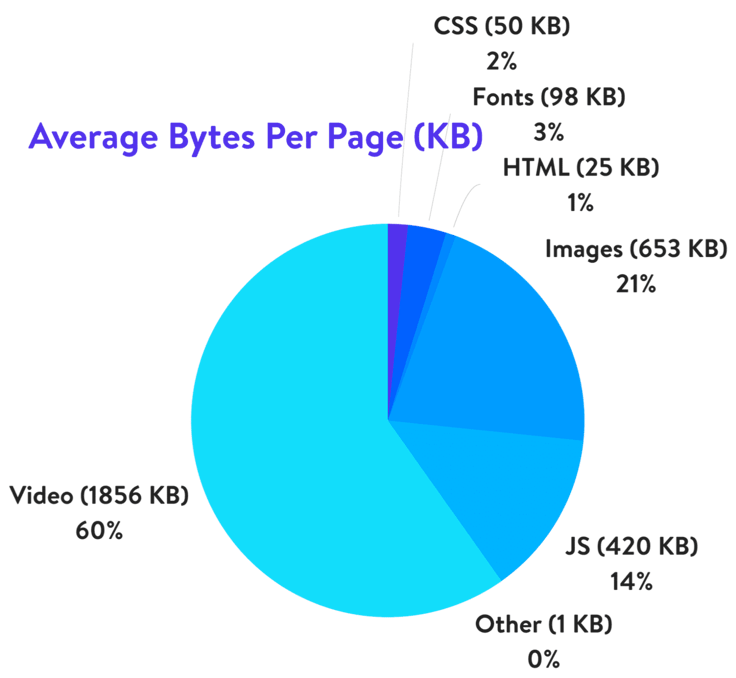
Website weight refers to how much data a website uses and includes elements such as text, images, and videos. You need to find the right balance between image size and quality to ensure website speed optimization.
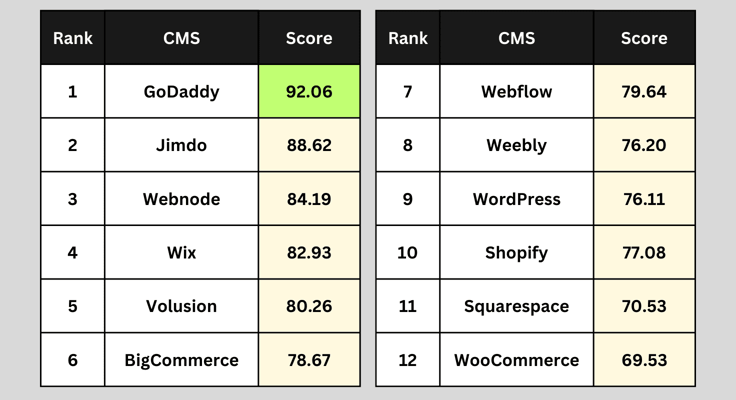
42. GoDaddy is the Best Website Builder, With a Desktop Score of 92.06
In terms of performance and website load time, websites built on GoDaddy fare the best, with GoDaddy scoring a solid 92.06 out of 100.2
To put it into perspective, the webpage loading speed of a site built on GoDaddy is 1.48 seconds, which is more than a second less than the average webpage load time.2,9 As an additional perk, GoDaddy offers a free domain name as well (as do most top web hosts).
43. IONOS-Built Websites Load in 1.23 Seconds
IONOS is the cheapest web host in the industry, and it is well-reviewed by the HostingAdvice team. Websites powered by IONOS are even quicker than GoDaddy, taking a mere 1.23 seconds to load.9
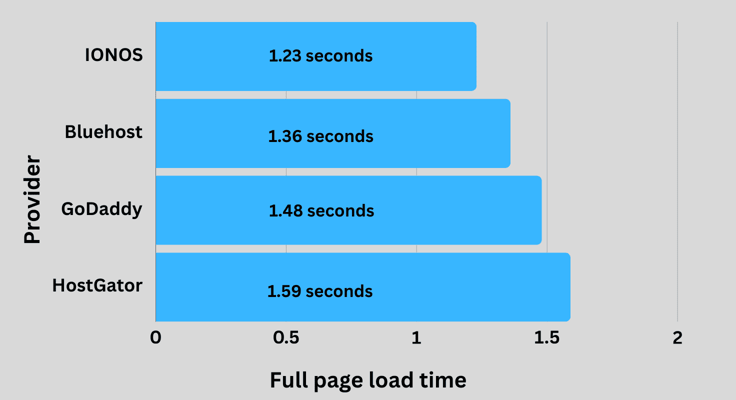
In comparison, websites built on other popular web hosting platforms, such as Bluehost and HostGator, take 1.36 seconds and 1.59 seconds to load, respectively.9
Speaking of Bluehost, it is the best web host for managed WordPress hosting. Look no further if you want to launch a WordPress site.
44. A2 Hosting Offers a Webpage Loading Speed of 0.295 Seconds
A2 Hosting is the quickest web host thanks to its super-fast, AI-powered infrastructure.
The popular web host offers a webpage loading speed of a mere 0.295 seconds.10
45. WooCommerce Has a Desktop Website Builder Score of 69.53
WooCommerce fares poorly as a desktop website builder, scoring just 69.53 out of 100.2 It is an important eCommerce plugin for WordPress websites, and unfortunately, it slows down those websites considerably.
It is understandable, though, as many eCommerce websites that use the WooCommerce plugin manage large online stores with a vast collection of images.
To improve the performance of a WordPress website that runs WooCommerce, opt for a fast web host that offers WordPress-specific optimizations.
Do You Know the Importance of Fast Website Loading Speeds?
The average customer attention span is just eight seconds.11 In comparison, the attention span of a goldfish is about the same.12 There is a reason TikTok and YouTube Shorts are so popular. With just eight seconds to play with, businesses must innovate to attract and engage customers.
A slow website not only consumes a significant amount of time but also puts off potential customers. The first step to building a fast website is to choose a reliable web host. An ideal web hosting partner will offer ample bandwidth, caching techniques, a CDN, and robust overall infrastructure to ensure quick page loading times.
To this end, we recommend some of our favorite web hosts: IONOS, Bluehost, HostGator, GoDaddy, and A2 Hosting.
Sources and Further Reading
- https://www.statista.com/statistics/896779/average-mobile-fixed-broadband-download-upload-speeds/
- https://www.tooltester.com/en/blog/website-loading-time-statistics/
- https://www.statista.com/statistics/896772/countries-fastest-average-fixed-broadband-internet-speeds/
- https://www.oberlo.com/blog/mobile-usage-statistics/
- https://www.worldometers.info/world-population/
- https://www.soocial.com/bounce-rate-statistics/
- https://www.websitebuilderexpert.com/building-websites/website-load-time-statistics/
- https://www.statista.com/topics/2711/us-smartphone-market/
- https://www.ionos.com/hosting/web-hosting/
- https://websitesetup.org/hosting-reviews/a2-hosting/
- https://dozanu.com/insights/blog/attention-span-of-your-average-customer/
- https://goldfishgo.com/what-is-the-attention-span-of-a-goldfish/


