



Writer: Jordan Sprogis


Editor: Lillian Castro


Reviewer: Cristian Lopez

Key Takeaways
- New Hampshire takes the No. 1 spot for digital career conditions, with a strong economy helping drive its overall score.
- The top five may not be who you expect, with D.C., Idaho, Utah, and Washington joining New Hampshire at the top of the list.
- Strong migration scores helped push Idaho, South Carolina, and North Carolina into the top 10.
- Higher incomes and educated workforces help some states stand out, while others are gaining ground through population growth or digital infrastructure.
Gone are the days when building a career in the digital economy meant packing your bags for Silicon Valley. Digital skills are now part of jobs across countless industries, from finance and healthcare to retail, manufacturing, marketing, cybersecurity, and professional services.
While the usual tech-heavy areas still have plenty going for them, they’re not the only places worth watching anymore. States continue attracting new residents every day, building educated workforces, and expanding their digital infrastructure to keep up with demand.
So if digital careers can happen almost anywhere, where are the best places to build them?
To see which states are the best for building a career in the digital economy, HostingAdvice analyzed all 50 states and Washington, D.C., across four categories: Economic Opportunity, Education & Workforce, Migration Trends, and Digital Infrastructure.
One important caveat: This isn’t a ranking of where you’ll find the most tech jobs, because the study doesn’t measure tech employment directly. It instead looks at the economic, demographic, and connectivity conditions that could help create an environment where people can build careers in a growing digital economy.
Top 25 States for Building a Career in the Digital Economy
Main Findings
The most important takeaway from this study is that the best places to build a digital career aren’t necessarily the states most people might associate with the tech industry. In fact, the states at the top of the list aren’t even on the roll call of America’s tech hubs.
New Hampshire claims the No. 1 position with an overall score of 58.91, driven largely by its economic performance. The District of Columbia follows at No. 2, where education and workforce indicators provide its biggest advantage. Idaho ranks No. 3, which is helped by consistent population growth and migration results.
Utah and Washington round out the top five: Both perform pretty well across economic and workforce measures, while Washington records the strongest Digital Infrastructure score among the five highest-ranked places.
The next five states show just how diverse the digital economy’s geography can be. South Carolina, South Dakota, North Carolina, Virginia, and Minnesota all make the top 10 despite having different economic and demographic profiles. South Carolina and North Carolina, in particular, benefit from strong migration results.
There’s no single formula for creating a favorable environment for digital careers. Higher incomes and an educated workforce can give a state an advantage, sure — but population growth and reliable internet access also play major roles.
| Rank | State | Abbr | Total Score | Economic Factors | Education and Workforce | Migration Trends | Digital Infrastructure |
|---|---|---|---|---|---|---|---|
| 1 | New Hampshire | NH | 58.91 | 72.5 | 51.69 | 57.92 | 50.37 |
| 2 | District of Columbia | DC | 57.37 | 71.64 | 78.67 | 11.3 | 50.07 |
| 3 | Idaho | ID | 57.28 | 44.52 | 56.5 | 84.67 | 50.19 |
| 4 | Utah | UT | 55.8 | 59.5 | 66.01 | 39.05 | 51.7 |
| 5 | Washington | WA | 55.27 | 59.82 | 55.95 | 50.46 | 52.24 |
| 6 | South Carolina | SC | 53.57 | 29.6 | 52.47 | 100 | 44.73 |
| 7 | South Dakota | SD | 53.02 | 56.77 | 53.48 | 50.17 | 49.58 |
| 8 | North Carolina | NC | 52.39 | 35.75 | 57 | 80.83 | 41.97 |
| 9 | Virginia | VA | 52.39 | 59.17 | 55.24 | 44.57 | 45.78 |
| 10 | Minnesota | MN | 51.84 | 56.28 | 55.88 | 41.71 | 49.26 |
| 11 | North Dakota | ND | 51.7 | 57.04 | 54.61 | 41.28 | 49.74 |
| 12 | Delaware | DE | 51.5 | 41.41 | 48.52 | 72.49 | 50.13 |
| 13 | Colorado | CO | 50.96 | 60.47 | 58.77 | 24.09 | 51.87 |
| 14 | Massachusetts | MA | 49.86 | 67.11 | 53.6 | 18.3 | 49.97 |
| 15 | Nebraska | NE | 49.7 | 55.07 | 53.66 | 36.12 | 49.3 |
| 16 | Maryland | MD | 49.48 | 61.27 | 52.62 | 26.54 | 50 |
| 17 | Connecticut | CT | 49.47 | 59.45 | 50.67 | 32.48 | 49.69 |
| 18 | Montana | MT | 48.83 | 46.02 | 43.61 | 60.38 | 49.32 |
| 19 | Maine | ME | 48.3 | 45.97 | 39.13 | 64.49 | 49.35 |
| 20 | Texas | TX | 47.57 | 37.16 | 58.81 | 54.42 | 39.47 |
| 21 | Wyoming | WY | 47.41 | 57.55 | 38.7 | 42.8 | 49.88 |
| 22 | New Jersey | NJ | 46.22 | 52.79 | 53.68 | 22.13 | 49.28 |
| 23 | Arizona | AZ | 45.73 | 37.16 | 42.88 | 60.64 | 47.97 |
| 24 | Tennessee | TN | 45.44 | 34.31 | 44.04 | 66.5 | 43.15 |
| 25 | Florida | FL | 44.57 | 39.96 | 41.15 | 54.55 | 46.64 |
| 26 | Georgia | GA | 44.48 | 33.77 | 49.93 | 51.72 | 45.13 |
| 27 | Wisconsin | WI | 44.08 | 51.11 | 39.61 | 37.7 | 46.61 |
| 28 | Kansas | KS | 43.22 | 43.25 | 45.72 | 33.99 | 48.67 |
| 29 | Nevada | NV | 42.3 | 23.61 | 42.89 | 61.77 | 50 |
| 30 | Rhode Island | RI | 42.25 | 39.25 | 44.89 | 35.25 | 49.82 |
| 31 | Vermont | VT | 41.79 | 53.03 | 36.58 | 24.51 | 50.02 |
| 32 | Iowa | IA | 41.47 | 45.56 | 39.96 | 31.41 | 47.65 |
| 33 | Missouri | MO | 41.34 | 39.34 | 38.01 | 45.79 | 44.88 |
| 34 | Indiana | IN | 40.93 | 37.44 | 39.39 | 44.63 | 44.78 |
| 35 | Oregon | OR | 40.05 | 39.58 | 35.58 | 37.07 | 50.43 |
| 36 | Oklahoma | OK | 38.51 | 27.74 | 34.68 | 52.83 | 46.07 |
| 37 | Hawaii | HI | 37.05 | 56.5 | 31.18 | 3.56 | 50.18 |
| 38 | Ohio | OH | 36.95 | 33.49 | 35.49 | 40.07 | 41.22 |
| 39 | California | CA | 36.81 | 48.76 | 34.61 | 4.03 | 54.97 |
| 40 | Illinois | IL | 36.57 | 38.17 | 40.37 | 20.63 | 44.39 |
| 41 | Alabama | AL | 36.23 | 25.51 | 28.52 | 57.3 | 42.81 |
| 42 | Alaska | AK | 35.84 | 47.6 | 37.15 | 1.95 | 50.12 |
| 43 | Arkansas | AR | 35.49 | 22.67 | 26.77 | 58.2 | 45.09 |
| 44 | Pennsylvania | PA | 35.23 | 37.15 | 33.2 | 32.48 | 38.17 |
| 45 | Kentucky | KY | 34.28 | 24.53 | 28.88 | 46.09 | 45.2 |
| 46 | Michigan | MI | 33.73 | 26.45 | 31.75 | 37.38 | 43.96 |
| 47 | New York | NY | 31.9 | 41.72 | 35.72 | 3.86 | 39.47 |
| 48 | West Virginia | WV | 25 | 15.85 | 4.19 | 48.06 | 46.9 |
| 49 | New Mexico | NM | 24.75 | 16.54 | 17.43 | 25.9 | 46.92 |
| 50 | Mississippi | MS | 23.01 | 9.65 | 15.75 | 33.28 | 43.66 |
| 51 | Louisiana | LA | 22.37 | 13.6 | 19.58 | 19.98 | 42.13 |
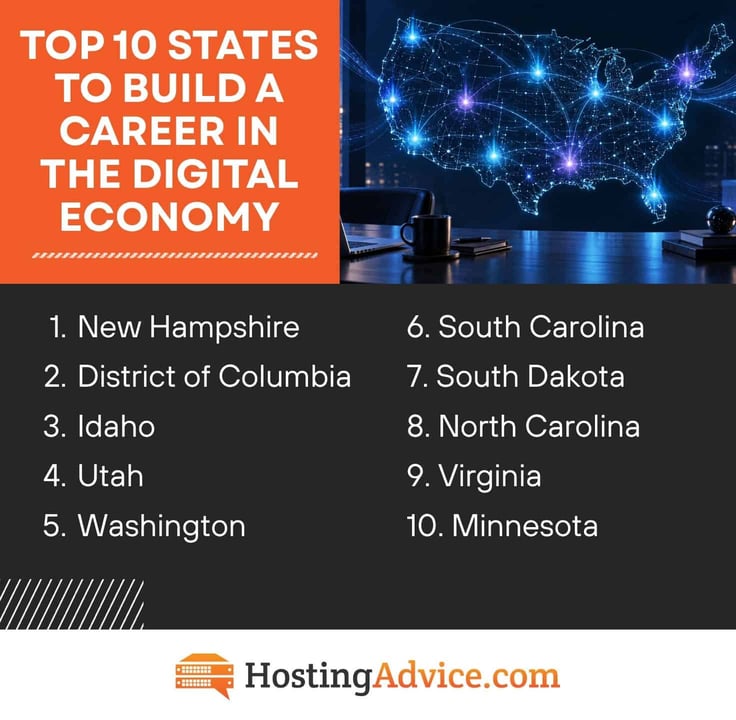
Top 10 States for Building a Career in the Digital Economy
- New Hampshire
- District of Columbia
- Idaho
- Utah
- Washington
- South Carolina
- South Dakota
- North Carolina
- Virginia
- Minnesota
What Sets the Top Five States Apart?
The five highest-ranked states suggest there are several ways a place can perform well in this ranking: Some stand out for their economic opportunity and educated workforces, while others benefit from population growth and migration.
Washington, D.C., is included as a state-equivalent jurisdiction.
1. New Hampshire
New Hampshire takes the No. 1 spot with an overall score of 58.91 and an Economic Opportunity score of 72.50.
Its income and employment indicators help drive that result, while a Migration Trends score of 57.92 adds to its performance. The state earns an Education & Workforce score of 51.69 and a Digital Infrastructure score of 50.37.
New Hampshire doesn’t lead every category, but its combined performance across the four measures is enough to put it at the top of the rankings.
2. District of Columbia
The District of Columbia ranks No. 2 overall, with its workforce standing out as its biggest strength.
The jurisdiction earns an Education & Workforce score of 78.67 and an Economic Opportunity score of 71.64. Its Migration Trends score, however, is just 11.30, the lowest of its four category scores.
That’s interesting: A strong workforce and economic performance can push a state toward a high overall ranking even when its migration numbers tell a different story.
3. Idaho
Idaho ranks No. 3 with an overall score of 57.28, helped by a Migration Trends score of 84.67. That’s the state’s strongest category by a long shot, but Idaho also earns an Education & Workforce score of 56.50, while its Economic Opportunity score is 44.52.
Idaho is probably the clearest example of why these rankings aren’t just about income or education: Its 84.67 Migration Trends is doing a lot of work here, with Idaho’s strong score suggesting that people moving into the state are a major part of its overall showing.
4. Utah
Utah takes the No. 4 spot with solid scores across a few categories. Its Education & Workforce score leads at 66.01, followed by Economic Opportunity at 59.50. The state earns 51.70 for Digital Infrastructure and 39.05 for Migration Trends.
Utah isn’t here on migration alone though. Its strongest scores actually come from its workforce and economic conditions, suggesting that the state’s top-five position has more to do with what’s already happening on the ground than people simply moving in.
5. Washington
Washington takes a different way to round out the top five with an overall score of 55.27.
The state earns 59.82 for Economic Opportunity and 55.95 for Education & Workforce. Its Migration Trends score is 50.46, while Digital Infrastructure comes in at 52.24, the highest infrastructure score among the five top-ranked places.
Washington’s scores are fairly consistent across these four categories. There isn’t a single standout metric that drives the state’s ranking; instead, it’s the strength of the overall profile.
Summary
The best places to build a career in the digital economy aren’t limited to America’s traditional technology hubs.
New Hampshire takes the No. 1 spot, thanks to its high-ranked economic conditions, while the District of Columbia stands out for its workforce score. (No kidding: Nearly 1 in 4 jobs in D.C. are federal government jobs.) Idaho rounds out the top three with an 84.67 Migration Trends score. The second half of the top ten brings us to South Carolina at No. 6 with a perfect 100.00 Migration Trends score, while North Carolina takes No. 8 with an 80.83.
So, while New Hampshire isn’t the next Silicon Valley, it shows that a place where you can build a digital career doesn’t have to fit one particular mold. Just as certain industries have spread beyond their traditional hubs, digital careers are no longer tied to a handful of cities. Economic strength, an educated and active workforce, population growth, and reliable internet access can all contribute to the conditions that help people build digital careers.
For media inquiries, please reach out to dennis@hostingadvice.com.
Methodology
The methodology below outlines the data sources, scoring approach, and weighted metrics used to create the rankings.
Overview
The Best States to Build a Career in the Digital Economy study compares states across four areas: Economic Conditions, Education & Workforce, Migration Trends, and Digital Infrastructure. Put together, these measures offer a broad look at the conditions people may encounter when building a career in the digital economy. The ranking focuses on these conditions instead of measuring digital job availability directly.
Data & Sources
Data for this study came from the Bureau of Economic Analysis, the U.S. Census Bureau, and the Census Population Estimates (PEP). These sources provided information on economic indicators, demographic trends, and educational attainment.
Only states with complete data across the selected metrics were included. States with missing information were excluded to keep the comparison consistent.
Scoring Approach
Each section assigns weights to its metrics based on their role in the overall ranking. Metrics are scored on a raw scale, with higher values generally representing more favorable conditions. The scores are then used to compare states across categories and calculate their overall rankings.
Caveats
The rankings are based on the available data and the specific metrics selected for the study, so keep in mind that they don’t consider every factor that can affect a state’s economy or a person’s career.
The study also doesn’t measure digital job openings, technology-sector employment, or individual career outcomes. Personal circumstances, including experience, industry, and location, can all affect how suitable a state is for a particular career.
Economic Factors — Overall Weight: 30%
The Economic Factors section looks at per capita personal income, median household income, and unemployment rates. These metrics provide a snapshot of income levels and employment conditions in each state.
1. Per Capita Personal Income — Single Weight
Per Capita Personal Income measures the average income earned per person in a specific area, providing a general look at income levels and economic conditions. The metric is scored on a raw scale, with higher values contributing positively to a state’s score.
2. Median Household Income — Single Weight
Median Household Income measures the middle income level among households in a state, adjusted for inflation, providing context on the financial conditions experienced by current residents. The metric is scored on a raw scale, with higher values contributing positively to a state’s overall score.
3. Unemployment Rate — Single Weight
Unemployment Rate measures the percentage of the labor force that’s actively seeking work but unable to find employment. Note that lower unemployment is considered more favorable because it generally points to stronger employment conditions. The metric is scored on a raw scale, with lower values contributing positively to a state’s score.
Education & Workforce — Overall Weight: 30%
The Education & Workforce section looks at educational attainment, labor force participation, and one-year population growth to provide a snapshot of the state’s workforce and population trends.
1. Bachelor’s Degree or Higher — Single Weight
The Bachelor’s Degree or Higher metric measures the percentage of people aged 25 and older who have earned at least a bachelor’s degree. Higher values indicate a larger share of the population with a bachelor’s degree or higher and contribute positively to a state’s ranking.
2. Labor Force Participation Rate — Single Weight
The Labor Force Participation Rate measures the percentage of people aged 16 and older who are either employed or actively seeking work. Higher participation rates contribute positively to a state’s score because it suggests that a larger share of the population is engaged in the labor market.
3. 1-Year Population Growth — Single Weight
The 1-Year Population Growth Metric measures the percentage change in population estimates over the most recent year. It provides a closer look at how a state’s population is changing, with higher growth rates contributing positively to a state’s overall score.
Migration Trends — Overall Weight: 20%
The Migration Trends section looks at overall net migration and domestic net migration to show how population movement varies between states. Because people move for many reasons — including employment, housing, family, and quality of life — the study treats positive migration as favorable without assuming those moves are solely driven by career opportunities.
1. Net Migration Rate (per 1,000) — Single Weight
The Net Migration Rate measures the net number of people moving into or out of a state per 1,000 residents. A positive rate means more people are moving into the state than leaving it, therefore, higher values contribute positively to a state’s ranking.
2. Net Domestic Migration Rate (per 1,000) — Single Weight
The Net Domestic Migration Rate measures net migration between states within the U.S. per 1,000 residents. The metric captures whether a state is gaining or losing residents through domestic (within U.S.) migration. Higher values contribute positively to the state’s score.
Digital Infrastructure — Overall Weight: 20%
The Digital Infrastructure section focuses on broadband internet access, using household connectivity to compare how connected states are. This is crucial for an economy where reliable internet access is needed for remote work, online tools, and digital services.
1. Broadband Internet Access — Single Weight
Broadband Internet Access measures the percentage of households with a broadband internet subscription. Higher access rates contribute positively to a state’s ranking. The metric measures whether households have broadband access, but not how fast, reliable, or high-quality that connection is.
2. Households without Internet — Single Weight
Households without Internet measures the percentage of households that don’t have internet access. Lower percentages contribute positively to a state’s ranking, indicating that fewer households are without an internet connection.