


Writer: Surajdeep Singh


Editor: Britain Simons


Reviewer: Cristian Lopez

Do you remember learning how to drive a car? I’m teaching my girlfriend, and she’s almost ready to take the test. Now, imagine the internet as a digital highway with me. Let’s say you want to watch the latest season of “The Night Agent” on Netflix (I highly recommend it).
When you click on the first episode, your device sends a car (data request) onto the road (WiFi network, mobile data, and fiber-optic cables) to fetch the data from the city (Netflix’s servers, in this case). The server loads the data packets (into your vehicle) and sends the car back to your device. With the episode delivered, the show begins!
All in a matter of milliseconds.
So what does traffic on this digital highway actually look like? I’ve pulled together 20 global data traffic statistics that paint the full picture. Buckle up.
1. Global Data Traffic and Generation Will Reach 237 Zettabytes in 2026
I mean, what are zettabytes (ZB)? How many zeroes is that? It’s a billion terabytes!
I have a fun exercise: can you guess how much data we create every day in terabytes (TB)? Think in billions — no cheating! If you thought of anything close to half a billion TB, trust your gut more often — your intuition is stronger than a Mike Tyson’s left hook, in his prime.
The actual figure is close to 650 million TB. That’s roughly 237 zettabytes (237 billion TB) of data created every year.1 237 zetabytes refers to all data copied, created, and consumed globally. This generally includes website traffic, corporate data, sensor data, AI automation, and user-crafted data.
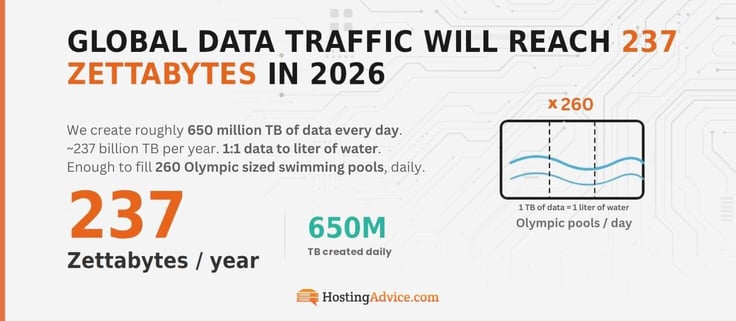
To make it easier to visualize, let’s say 1 TB of data = 1 liter of water. Every day, we create enough data to fill about 260 Olympic-sized swimming pools!
2. Global Data Traffic is Growing at a CAGR of 22%
We’re closer to 2030 than 2020. Whew, time flies! Here’s another fun global data traffic statistic: we’re projected to create 22% more data in 2026 than in 2025. That’s an exponential increase. Are we really consuming that much data?
I mean, I pretty much use the same apps on my devices. What about you? And it’s not like Netflix offers 3D streaming. So what’s changing?
The number of users and devices, for starters. How often do you use ChatGPT and other AI tools? General estimates say AI uses 10 to 15 times more energy, and quick adoption means that’s a big chunk of data packets per search. And who can forget automated background traffic (like updates and backups) for apps, devices, and websites.
If I take 22% as a fixed annual growth rate, that’s around 491 ZB of global data traffic by 2030.1 I wonder how many pools that’ll fill!
3. There Are 6.04B Global Internet Users
The last global data traffic stat got me thinking: “How many of our ~8.2 billion Earthlings are connected to the internet?”
My optimistic estimation? At least 90% were online, but far from it. Around 6 billion people are connected to the internet, which is roughly 73% of the global population. Just 73%.
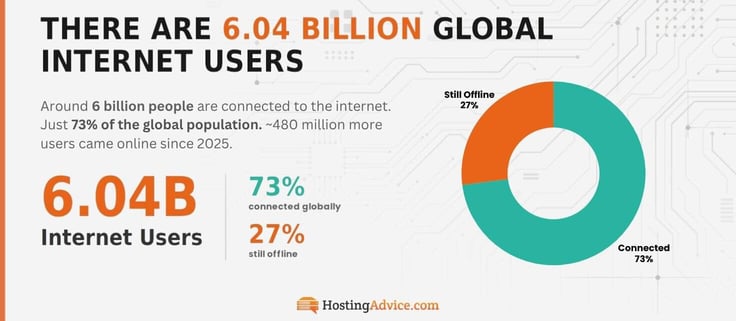
I hope a large chunk of the 27% which are in the dark (literally, in some cases) have the opportunity to surf the lightspeed-highways of it by the end of 2026. Another prayer to sing tonight. If I look at the flipside, there are about 480 million more internet users today than in 2025.1,2,3,4
4. Europe Is the Only Continent With a 90%+ Internet Penetration Rate
How many of the 27% are offline by choice? My grandmother has the opportunity to connect with her family online, but she prefers calling the old-fashioned way. And I’m sure there are several senior citizens like her (I know four). That would fall under “user capability” (or literacy). Other important factors are affordability, accessibility, and infrastructure.
Also, I’m not sure how my source (Statista) determined the connectivity of children to the internet. Does watching a cartoon on a tablet at the age of 2, 3, or 4 count toward full internet adoption status? Perhaps.
What I can confirm is that Northern Europe takes internet adoption pretty seriously — about 97.7% of them are online. North America isn’t that far off with a 93.3% internet adoption rate. Which country do you think has the most internet users overall? The US, China, or India?
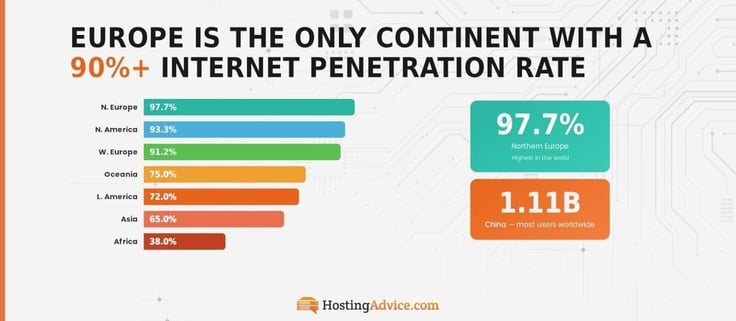
China it is! With around 1.11 billion users, if we are to rely on their reported numbers.3,5,6
5. Global Internet Adoption Will Cross 90% in 2028
The internet is growing at a steady rate of around 8.63%, and the global population is growing at about 0.84%. What I’m getting at with this — when will global internet adoption reach at least 90%?
Current trends point to late 2028. Could 99% adoption be possible? We’ll see in early 2030.2,3,4
Now, I know it’s impossible to reach 100% internet adoption, but hey, the numbers paint a bold picture! Socioeconomic and geopolitical factors aside, I’ll probably be able to convince Gran-Gran by then. She does watch the occasional reel on my sister-in-law’s phone…
6. Video Streaming Accounts for over 70% of All Internet Traffic
Some sources have made data projections (predictions) around 82% according to a Cisco 2016 report, but according to Sandvine 2024 data, we’re looking at around 70% of internet traffic coming from video streaming.7
Go to your phone’s battery settings and tell me how much of it you spend on streaming services like Netflix, YouTube, and TikTok. More than 50%? Mine is around 30% — I prefer streaming on TV.
Video streaming accounts for a big slice of the internet traffic pie. Well, 70% is more than two-thirds of the pie.7 File delivery and browsing fall after. We sure have big appetites!
7. Mobile Devices Generate Roughly 62.7% of Total Data Traffic
Let’s continue the theme: when’s the last time you watched a YouTube or TikTok video on your computer? Video streaming just feels so much more personal on your smartphone. I only use my laptop for work.
Another way of looking at this headline is that around a large portion of the 62.7% of people on mobile use the internet for “personal entertainment.”8 I’m sure some of you respond to the odd work email on your smartphone and design on Canva, but you know where I’m coming from.
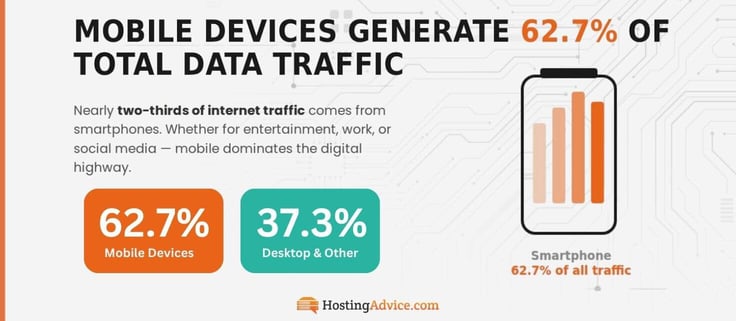
Whether you use your phone mainly for personal entertainment or work, mobile devices account for 62.7% of total data traffic.
8. The Average YouTube User Consumes 2.8 GB of Data Daily
Can you guess which app has the most data traffic per user, per day? Here are the numbers:
A. Netflix, with about 5.3 GB.
B. Hulu, with around 4.4 GB.
C. Amazon Prime with roughly 3.2 GB and…
D. YouTube just edges Disney+ (2.6 GB) with approximately 2.8 GB.
I use four of these apps almost every day. We’ll analyze how we generated this stat by calculating the amount of data you might spend on YouTube.
We’ll enter the resolution you may watch videos in, and the duration you might spend. According to research, the average YouTube user spends about 49 minutes on the app (across devices).7,9
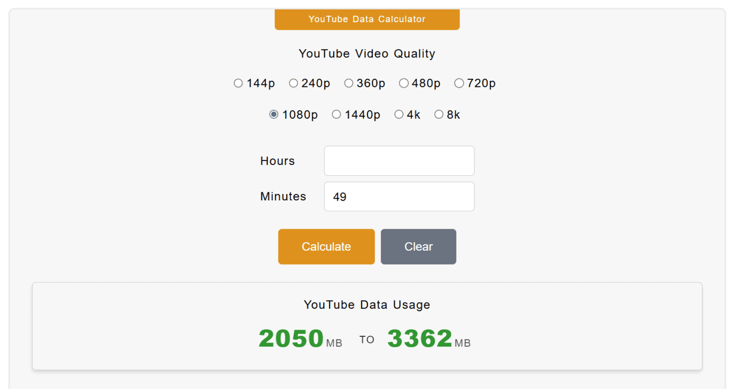
A successful test!
There’s no way we’re streaming in anything less than 1080p, right? 2.8 GB falls right in this range.7,9 I probably contribute more to this total than the average YouTube user, because I believe you can learn anything from it, and my thirst for knowledge knows no bounds. I also blame MrBeast.
9. The Average Smartphone User Consumes 21.6 GB of Mobile Data Per Month
Which cellphone provider do you use? Verizon, T-Mobile, or AT&T? We all use a ton of data on our smartphones. I have two mobile packs with a combined daily usage limit of 5 GB. I rely on WiFi too. Don’t let the headline confuse you, that’s 0.72 GB of cellular data per day!
Here we’ll compare data consumption for the apps I mentioned on broadband vs. mobile networks.
This data is from the same SandVine study:
| App | Fixed Broadband | Mobile Networks |
|---|---|---|
| Netflix | 4.2 GB | 1.1 GB |
| Hulu | 3.1 GB | 1.3 GB |
| Amazon Prime | 2.6 GB | 0.6 GB |
| YouTube | 2.5 GB | 0.3 GB |
| Disney+ | 2.4 GB | 0.1 GB |
Can you see any patterns? Users prefer high-quality streaming on broadband and probably switch to a lower resolution on mobile.7,10
10. 5G Networks Now Carry About 43% of Global Mobile Traffic
Do you remember the 2G days? I had a Nokia E61 handset between 2006 and 2008 and remember talking to my friends through SMS and Facebook. The concept of an app store didn’t exist, so I used to log in to Facebook through a browser. Gosh, we had such patience back then — the page loading speeds were catastrophically slow!
Now? I can open Google in Safari on my phone using Jio’s 5G network in under 2 seconds (I just checked). My cellular networks do automatically switch between 5G, 4G, and LTE on occasion, but 5G is predominant. Are you surprised that 5G’s share of mobile data traffic is only around 43%?11
Unfortunately, a lot of people still use 3G, 4G, and even 2G handsets (like my granny).
11. Cloud Data Centers Handle More Than 90% of Worldwide Traffic
We’ll stick with our car analogy. Almost every car that leaves a garage (data packets) is heading for a “cloud city”— on roughly 9 out of 10 occasions.12 Even our website, HostingAdvice.com, is hosted on cloud servers.
Very few data requests are handled by on-premises servers, P2P, or edge devices (more on this in the next stat).
Cloud data centers are like massive warehouses, or data “parking garages,” that can serve millions of cars at once. Companies like Netflix just “rent” parking. So, your car, and all its users’ cars, can come and go as they please.
We all benefit from the security, scalability, always-on (high uptime), simple tools (easy login/ access), and management of cloud providers — instead of spending money on and maintaining our own infrastructure.
If you were a business owner, would you rather build a warehouse or rent one? If you’re a user, it would take a huge investment to store, purchase, and maintain a massive movie and TV library like Netflix — just for yourself.
12. Annual Cloud Traffic Will Cross 213 ZB in 2026
If you enjoy watching the latest movies and shows at home while munching on flavored popcorn or jiving to TikTok dance trends, you know who to thank — cloud data centers!
We “travel” to cloud cities for our data more often than not, but there are several occasions on which we don’t have to fasten our seatbelts. If you’ve downloaded a Netflix movie, Spotify song, or directions in Google Maps, it’s on your device’s local storage. Your WiFi can also act as a local environment when you print a document at home. Many apps, like games, also live locally on your device.
But, when it comes to cloud traffic, there is one more “data stream” to factor in.
Edge caching — let’s talk about it. Say several people in your locality watched “The Night Agent” before you could get caught up. Netflix sees the show is “hot” in your region and copies the content to the nearest local mini-warehouse, called Open Connect Appliance, specialized CDNs (Content Delivery Networks) — an edge server on local ISPs.
So, the next time someone wants to watch the show with you, you can thank the nearest edge server for instant entertainment! Cloud data centers are the foundation of the internet highway. We can expect a minimum of 213 ZB of annual cloud traffic in 2026.1,12
13. Approximately 80% of Enterprise Workloads Run in the Cloud
We already know how dominant cloud traffic is, so it shouldn’t surprise you that around 80% of enterprise workloads run in the cloud. These workloads store, manage, and analyze enterprise data, run applications, power team communication, and route network traffic.
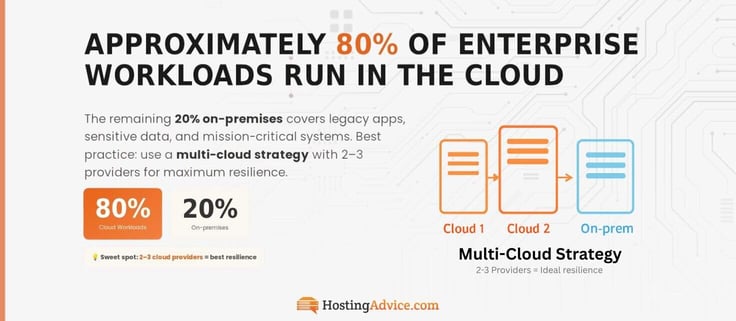
What about the remaining 20% of workloads that stay in on-premises servers?
That’s where you’ll find legacy applications, highly sensitive data, mission-critical systems, and internal tools.13 Basically, any IT task that needs to be protected on a company server.
What happens if your on-premises servers fail or security is breached? Do your business operations come to a screeching halt? Not quite — if you’ve planned well. Mirroring important internal data in backup servers, a standard practice. Your operations keep running even if on-premises servers fail.
Overall, enterprise workloads operate best on a multicloud strategy (2-3 cloud providers is the sweet spot) that replicates all critical workloads across secure servers — never put all your eggs in one basket. Reduce downtime and add extra resilience and flexibility to your operations.
14. 30% of Global Traffic Will Come from AI and Machine Learning Workloads in 2034
How often do you use AI tools? ChatGPT is practically my digital best friend!
Since ChatGPT receives about 2.5 billion prompts every day from 50 million subscribers, and each has around 20 KB of input data, that’s approximately 18.25 PB (petabytes), or 18,250 TB, of data traffic every year from inputs alone.
Can you imagine how much traffic is generated by data-intensive image and video-based tools like Stable Diffusions, Midjourney, and Runway Gen-2? These workloads are huge. Training generative AI models with complex images autonomously using Stable Diffusion is no piece of cake — that’s a huge chunk of data traffic growth.
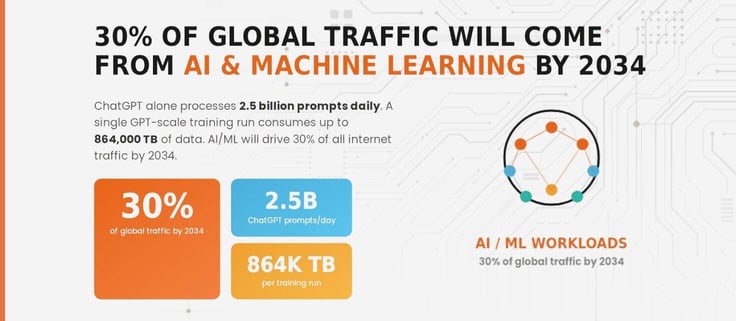
According to research, a single ChatGPT “training session” with more than 175 billion parameters (at GPT scale)can take between 2-3 months and consume as much as 864,000 TB (400 TB of network traffic/hour across 25,000 GPUs), with data-hungry AI/ML workloads.
Smaller tools with fewer parameters take less time and compute, and, of course, generate less data traffic. The thing is, there are tens of thousands on the market — many of which are trained in these data centers.
While we know training is a compute-intensive workload, it also involves heavy data traffic. No wonder AI/ML workloads will account for around 30% of global data traffic by 2034!14,15,16,17,18
15. IoT Devices Account for 6.3M TB of Global Data Traffic Per Month
You may be wearing a smartwatch — a great option to track health metrics and daily step count. A smartwatch is an example of an IoT device.
Any device with a sensor that’s connected to the internet and autonomously collects and shares data is an “Internet of Things” device. There will be 22.3 billion of them in 2026 — that’s ~76 million TB of IoT data traffic per year.19,20 Mind you, I could do with a smart fridge that notifies me every time my housekeeper leaves the freezer door open a fraction! According to current data, that means IoT devices account for 6.3M TB/Month of data.
16. Connected Devices Worldwide Reach 33.5 Billion Units
Laptops, smartphones, and televisions don’t magically sense the world around them like a thermostat or heart rate monitor — we operate them. That’s why we don’t count them as an IoT device. The thing they have in common — they’re tapped into the global data network.
So, how many devices are actually connected to the internet? 33.5 billion.19
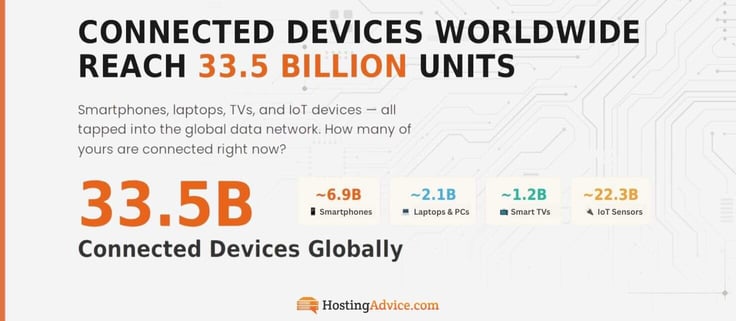
How many of your devices are online? You can check your Wi-Fi router, likely via an app, to see all connected devices. I have a smartphone, laptop, and television — that’s all. Three may be on the low side. It’s time to buy that smart fridge!
17. Online Gaming Represents About 7% of Global Data Consumption
What online games do you play? You likely have at least one game on your smartphone or computer. Who doesn’t? My mom still plays Candy Crush every day and is pretty good at it.
Online gaming accounts for only about 7% of our global data consumption — you might have expected this figure to be higher. This should mean Gen-Z, in particular, spends significant time playing outdoors the other 93% of the time, right? Wrong.
Truthfully, Gen-Z spends approximately 3 hours and 18 minutes every day on social media.7,21 Might be time for the new generation to touch some grass, and play some frisbee.
Can you imagine how high the numbers could be for Gen Alpha (those born in or after 2013) when they truly come of age? Many are already online — My four-year-old nephew watches cartoons on my brother’s phone for hours!
18. Social Media Platforms Drive Roughly 18% of Internet Traffic
Are we on social media too much? Whenever I go out for a walk, I observe the people that pass by — many half-buried in their phones — no wonder 18% of internet traffic comes from social media.
TikTok is the world’s most addictive app, allegedly, so try to spend less time on it. TikTok users spend almost an hour on it every day.7,21
Personally, I’d rather read a book or watch a movie. I’ve been off social media for more than a year now (I use a burner X account to follow news and sports updates) and feel calm. Highly recommended!
19. The Average Household Uses Around 832 GB of Data Per Month
My home is fiber-enabled, so the internet speed is consistently over 100 Mbps. A welcome improvement. Do you remember the legacy broadband days?
I’ve watched so many blurry movies from slow connections!
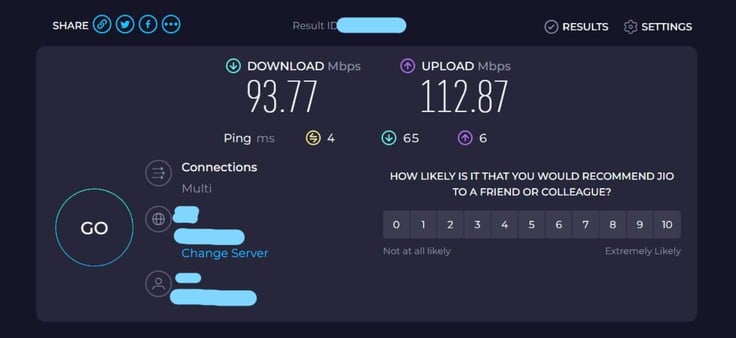
Speed is a modern luxury that lends itself to higher consumption. The average household uses around 832 GB of data every month! It’s definitely up from the past US conservative average of 700 GB per month.
If you’re curious, that breaks down to about 767.4 GB of broadband data and approximately 64.8 GB of mobile data. That’s the global average for a family of three, like mine.
277 GB of data per family member each month is a lot!11,23
20. 49.2% of Websites Are Written in English
We both knew English was going to lead this list. My question for you is, can you guess the top five most used languages for web content? I’ll give you some context: there are more than 1.34 billion websites.
Here are the top five:
- English: 49.2%
- Spanish: 6%
- German: 5.9%
- Japanese: 5.2%
- French: 4.4%
Are you really telling me there are about 79 million websites in German?24,25 I haven’t visited a single one! I wonder what I’m missing out on…
What These Global Data Traffic Statistics Mean for the Future
You don’t need me to spell it out for you — we’re all spending more time online. But I do want to encourage you to enjoy what’s around you more.
When’s the last time you went to a park to toss a Frisbee or feed ducks? Botanical gardens, museums, and community events are worth the visit! The internet will get even faster and more enticing, so make the effort to experience more!
As technology, AI, gaming, and social media evolve, digital experiences will improve — we’re bound to double or triple our data consumption soon enough.
I went on a solo trip in February 2026 and had the time of my life. It helped me reconnect with who I am. Do share your thoughts on our social media below (@Hostingadvice). We’d love to hear from you! I look forward to reading your comments!
Sources and Methodology
1. https://www.statista.com/statistics/871513/worldwide-data-created
2. https://www.worldometers.info/world-population
3. https://www.statista.com/statistics/617136/digital-population-worldwide
4. https://www.statista.com/topics/1145/internet-usage-worldwide
5. https://www.statista.com/statistics/269329/penetration-rate-of-the-internet-by-region
6. https://www.statista.com/statistics/262966/number-of-internet-users-in-selected-countries
7. https://www.sandvine.com/hubfs/Sandvine_Redesign_2019/Downloads/2024/GIPR/GIPR%202024.pdf
8. https://www.statista.com/statistics/277125/share-of-website-traffic-coming-from-mobile-devices
9. https://bloggerspassion.com/youtube-statistics
10. https://www.ericsson.com/en/reports-and-papers/mobility-report/reports/november-2025
11. https://www.ericsson.com/en/reports-and-papers/mobility-report/dataforecasts/mobile-traffic-forecast
12. https://newsroom.cisco.com/c/r/newsroom/en/us/a/y2018/m02/global-cloud-index-projects-cloud-traffic-to-represent-95-percent-of-total-data-center-traffic-by-2021.html
13. https://www.datastackhub.com/insights/cloud-usage-statistics
14. https://www.nokia.com/artificial-intelligence/explainer-network-traffic-is-fundamentally-changing-in-the-ai-supercycle
15. https://openai.com/index/scaling-ai-for-everyone
16. https://www.axios.com/2025/07/21/sam-altman-openai-trump-dc-fed
17. https://introl.com/blog/bandwidth-optimization-distributed-training-400gbps
18. https://www.linkedin.com/pulse/complete-technical-guide-training-large-language-models-bedi-kj–nzflc
19. https://www.statista.com/statistics/1559435/connected-devices-worldwide
20. https://www.simplexwireless.com/2025/12/15/how-much-data-does-your-iot-device-really-need-a-practical-guide-to-right-sizing-your-connectivity-plan
21. https://sqmagazine.co.uk/social-media-screen-time-statistics
22. https://www.speedtest.net
23. https://www.benton.org/headlines/q4-2025
24. https://www.statista.com/statistics/262946/most-common-languages-on-the-internet
25. https://www.hostinger.com/tutorials/how-many-websites-are-there