TL; DR: The Digital Scholarship Lab at the University of Richmond promotes the visualization of American history through the lens of digital mapping. Since 2007, DSL has used innovative media techniques to depict data-heavy humanities topics and make them more accessible to the general public and scholars. Its American Panorama atlas contributes to the conversation on American history and includes comprehensive backgrounds on pivotal events, including the Slave Migration and the Homestead Act. The lab updates its maps with real-time data and reveals historical patterns over significant periods.
In recent years, the conversation surrounding social justice and its ties to patterns in American history events has grown expeditiously. More people have become focused on learning about these pivotal events in a larger context, whether through documentaries or online research.
Since 2007, the Digital Scholarship Lab at the University of Richmond has used innovative mapping as a medium to recount American History from a new perspective. The DSL team takes data-intensive research and conveys it in a more simplified manner for scholars and the general public alike.
“From a historian’s standpoint, you can look at these numbers all day in a spreadsheet. But until you put them into a visualization, it’s hard to pick out the patterns that we’re showing and the stories we are telling,” said Justin M. Madron, DSL Associate Director.

Created by Edwards Ayers, the former President of the University of Richmond, the Digital Scholarship Lab works with scholars and enlists the aid of undergraduate students to form its interactive maps.
DSL’s historical atlas is named American Panorama to call attention to various events that shaped American History and reframe them in a truthful, holistic way. The atlas is an ongoing project, and the lab continues to add more maps to catalog other ground-breaking historical events. The lab uses cutting-edge research and mapping technology to divulge details on America’s complex past and help people better understand it.
DSL designs its projects to appeal to anyone with a love for maps or an interest in American History. Some of the lab’s projects include “Redlining in New Deal America,” “Forced Migration of Enslaved People,” and “Photogrammar.” Its Homesteading Project is the most recent piece of the atlas to go live.
Above all, DSL seeks to expand the conversation on American History. Its projects allow the general public and scholars to access the complete background and story view without any retractions.
Spatial Distribution Through the Lens of Digital Mapping
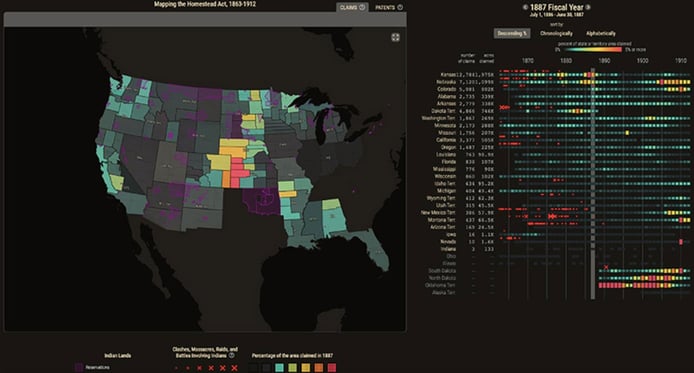
Justin manages the spatial data that goes into the DSL maps. He and the DSL team had begun developing a new display before the pandemic and recently completed it. Its latest project tracks the Homestead Act of 1862, which provided 160 acres of free land to anyone who agreed to farm the land. These maps explore the research behind the land claims and how they changed the American landscape. They also show how — often through violence — these claims dispossessed Native Americans of their land.
The Digital Scholarship Lab teamed up with a scholar from Germany named Julius Wilm to get the project running and source its raw data. Julius’ extensive knowledge of the American West helped DSL design and populate its Homestead map.
“Julius amassed all of the fantastic archival materials on claim offices. We got to work mapping those along with claims data, patent data, as well as Indian lands,” said Justin.

The Homesteading Map has a separate landing page from the rest of the atlas because it is very data-intense. It displays land claims by city, how land offices changed, and the battles for Indian territory over 49 years. The process involved a high level of georeferencing of state maps to ensure accuracy.
“These maps require a little more explanation because of how much data is being presented. There are helpful videos that show you how to best interact with the maps and show change over time as well as the nitty-gritty of diving into some of the visualization components,” said Justin.
DSL blends the aesthetics of static and digital mapping to innovatively depict the Homestead Act. The two maps are stitched together, with the original map placed behind the digital one. The overlaying colored polygons show the percentage of areas claimed, sourced from the National Archives and the Land Office.
“We wanted to keep the aesthetic of the original office maps. So what you’ll see is the original maps in the background as they change through time,” said Justin.
Increasing the Conversation Around American History
The DSL team wanted to ensure its maps shared the whole story, even the often overlooked details such as the massacres and battles with Indians to acquire the land. This way, DSL can convey historical information truthfully and give its audience all the facts.
“Through this process you can clearly see Indian lands being claimed and taken over. This is an important piece we wanted to highlight to the users,” said Justin.
A significant part of DSL’s mission is to increase the conversation and general awareness of historical events through an interactive approach. The team seeks to use its visualization technology to inform people on pivotal historical events that can encourage further discourse.
“It’s expanding the conversations around American history at several different levels. We would like the general public and scholars to come to one of our projects and learn something new from that piece of American history,” said Justin.
Justin also said the DSL team hopes its maps can be an outlet for scholars to gain a comprehensive understanding of the American story.
“We want scholars to come to our projects and use that information to spark new research or discover something they didn’t know before, which would drive new scholarship,” said Justin.
How DSL Gets Projects Off the Ground
When selecting a subject to map out, the DSL team focuses on topics that fit into its overall mission of American panorama. Justin said the ideas typically come to them organically. For example, sometimes scholars reach out to DSL with their ideas. Justin said that’s what occurred with the “Photogrammer” and the “Mapping the Homestead Act” maps.
A scholar from Germany, named Julius Wilm, suggested the homesteading idea and offered to help them build the map. As for the “Photogrammer,” the team’s colleagues who initially worked at Yale University came to the university with a previous version of the project already completed.

“Our colleagues Lauren Tilton and Taylor Arnold built (the Photogrammer) at Yale before they came to University of Richmond, and so it needed a refresh. We worked with them to add new features and capabilities given the advancements in mapping technology,” said Justin.
And DSL continues to refresh and update its maps. It recently received a grant to expand on the quality of its redlining map and redlining practices at a local level. Justin said the team obtained 80 new maps from the National Archive and has more than 100 to gather for its redlining project.
Real-time data points will keep coming in as information continues to live and breathe. The lab looks to add information from the 2020 census to other related maps and include more projects to its atlas.
“We can now update some projects with 2020 data. We will focus on updating projects like Electing the House of Representatives and adding new data to the projects like Executive Abroad. And then, of course, the redlining stuff is going to be a big push,” said Justin.
HostingAdvice.com is a free online resource that offers valuable content and comparison services to users. To keep this resource 100% free, we receive compensation from many of the offers listed on the site. Along with key review factors, this compensation may impact how and where products appear across the site (including, for example, the order in which they appear). HostingAdvice.com does not include the entire universe of available offers. Editorial opinions expressed on the site are strictly our own and are not provided, endorsed, or approved by advertisers.
Our site is committed to publishing independent, accurate content guided by strict editorial guidelines. Before articles and reviews are published on our site, they undergo a thorough review process performed by a team of independent editors and subject-matter experts to ensure the content’s accuracy, timeliness, and impartiality. Our editorial team is separate and independent of our site’s advertisers, and the opinions they express on our site are their own. To read more about our team members and their editorial backgrounds, please visit our site’s About page.


